How Agencies Report AI Visibility to Clients (With a Real Report)
Every agency selling GEO or AI-visibility work hits the same wall within a month: the client asks to see it. Not a dashboard login — a report, next to the Google Ads and GA4 numbers they already get, that a CMO can forward upward without a translator. Most AI-visibility tools answer this with a CSV export. This is the other answer: what belongs in a monthly AI-visibility client report, what to leave out, and a walk through a real one.
By Philipp Enders·Founder, CrunchJunkie·LinkedInBuilds the reporting and AI-visibility tooling this analysis was run with.
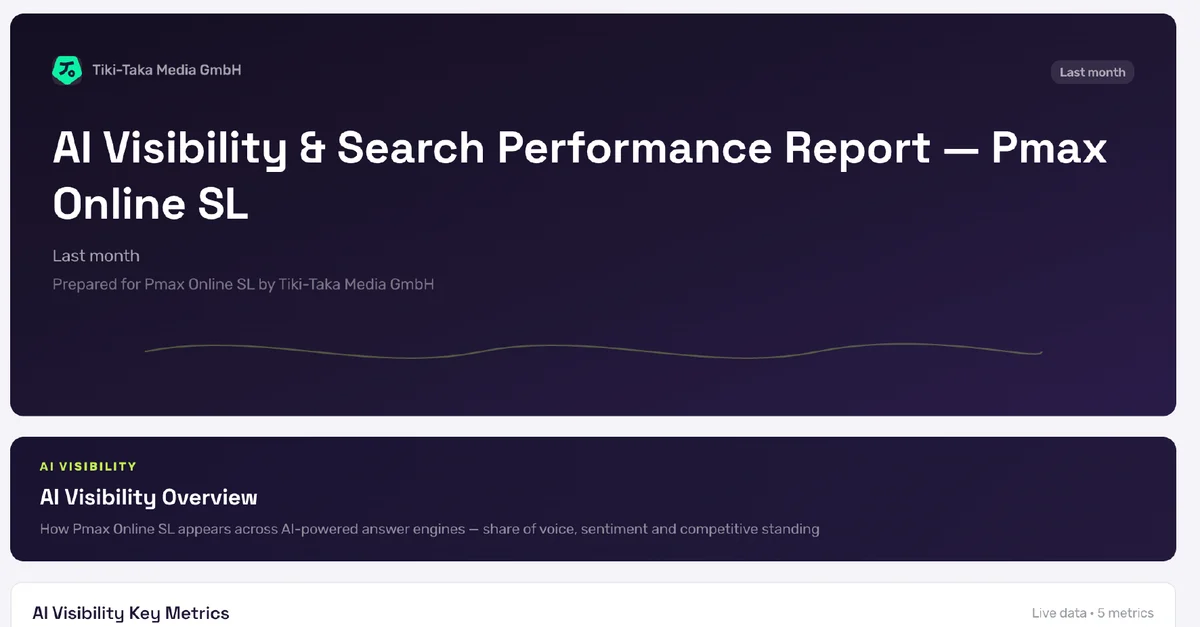
The deliverable this article is about: a monthly AI-visibility report a client actually opens — agency logo, client brand, live data.
What the client is actually asking for
Not more data — an answer. "Is this AI thing working, is it worth what we pay you, and what are you doing next month?" A client report earns its keep when those three questions are answerable from its pages alone.
That framing rules out the two default failure modes. The first is the dashboard screenshot dump — forty charts, no argument. The second is the vanity single number, an "AI score" that went up. The first is unreadable; the second is indefensible the moment a client asks what the number means. The report that works sits between them: few numbers, each one defined, each one carrying its sample size, arranged to support a narrative a human wrote.
The five numbers that survive a client meeting
After a year of sending these, our set is: visibility (share of scan runs naming the brand, with its ± margin), share of voice against named competitors, average position when listed, mentions by engine, and — the one that changes the meeting — the tie to outcomes: sessions, conversions and revenue that AI assistants actually referred, from the client's own GA4.
Two disciplines make these survive scrutiny. Every rate carries its n: "35.3% visibility on 2,940 runs" is a claim, "35.3%" alone is a decoration. And null is null: an engine with too few decisive runs shows a dash, not a zero — a rule that has saved us more client-meeting credibility than any chart. If a competitor's sentiment score is built on three mentions, the report says so or doesn't show it.
What to leave out: raw mention counts without denominators, blended cross-engine scores, and anything measured once. We wrote up the full metric definitions — and the five metrics that lie — in the metrics guide; the client report is that guide's short, opinionated edit.
A real report, page by page
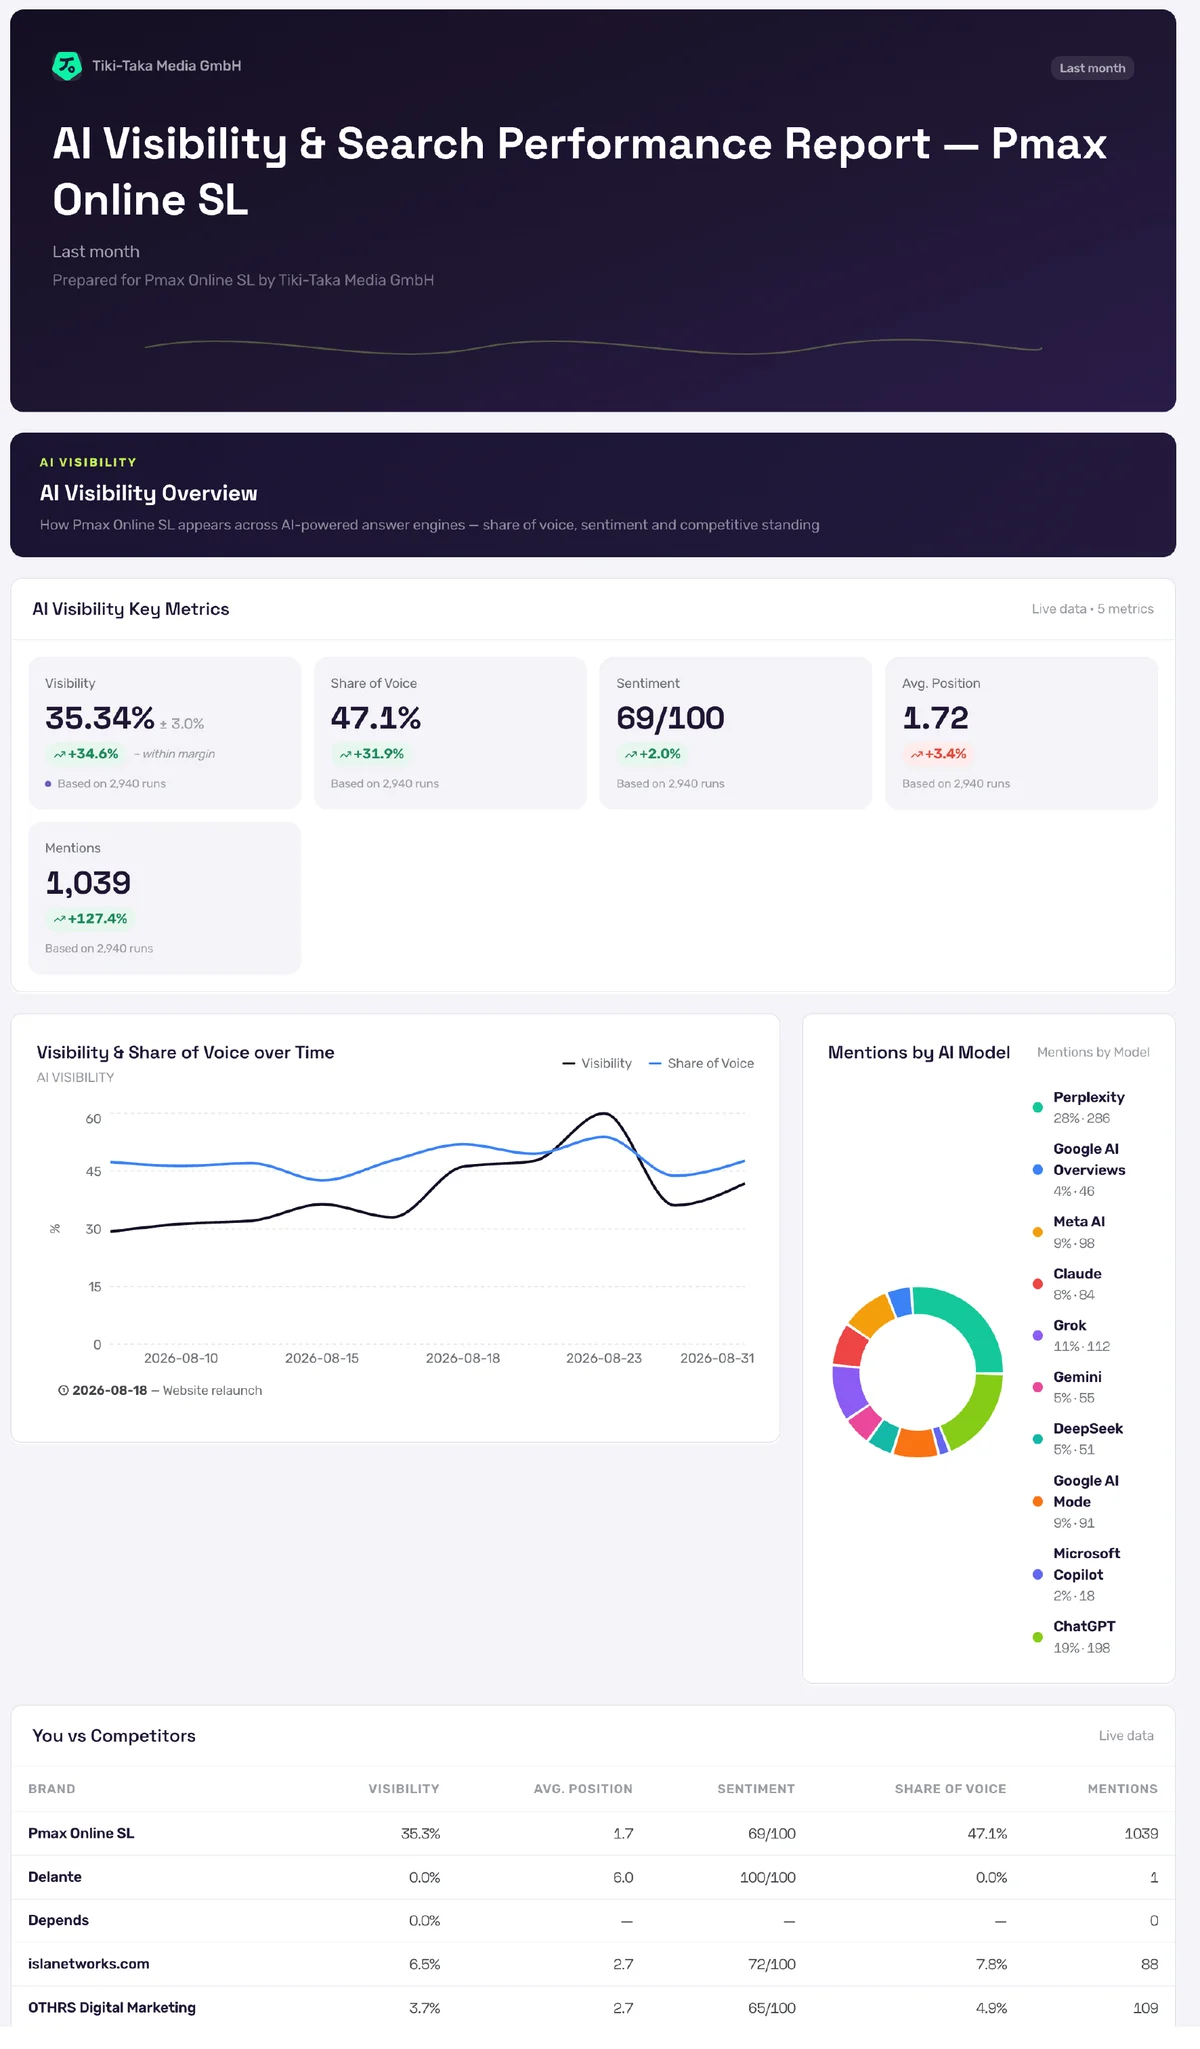
The report in these images is our own agency's August report, exactly as generated. The cover carries the agency's branding, the client's name, and the period. The KPI row leads with visibility at 35.34% ± 3.0 — and its month-over-month change annotated "within margin", the report literally refusing to sell noise as progress. That one label does more for client trust than any chart: it teaches the client that when the report does claim a move, the move is real.
Then the trend: visibility and share of voice over the month, with a timeline annotation on 18 August — "Website relaunch" — pinned to the chart, so the story explains itself at the glance ("the dip is the relaunch, and it recovered"). Annotations are the difference between a chart and an explanation; every meaningful account event should be on the chart that felt it.
Then mentions by engine — a donut across all ten engines, which quietly answers "where does this number even come from" — and the competitor table: visibility, position, sentiment and share of voice for every tracked competitor, same period, same methodology. Clients rarely remember their own number; they always remember being ahead of the rival.
The August report as generated: a +34.6% headline change marked 'within margin', a relaunch annotation explaining the trend, and competitors measured with the same instrument.
Next to the money, or it doesn't count
The section that converts skeptical clients is never the visibility chart — it's the one where AI visibility sits next to GA4: the sessions, conversions and revenue whose source was a known AI assistant. Stated honestly, that number is a lower bound (analytics attributes some AI referrals to direct), and the report should say so in exactly those words. Understatement is a feature here: when the lower bound already justifies the retainer line, the argument is over.
We've written about why this pairing matters beyond reporting — a brand can gain AI visibility while its site loses sessions, and only seeing both trends on one page catches it. For the client report, the practical point is simpler: the AI section belongs in the same document as Google Ads and GA4, not in a second tool with a second login. One report, one period, one answer to "is it working".
Assembling it in a sentence
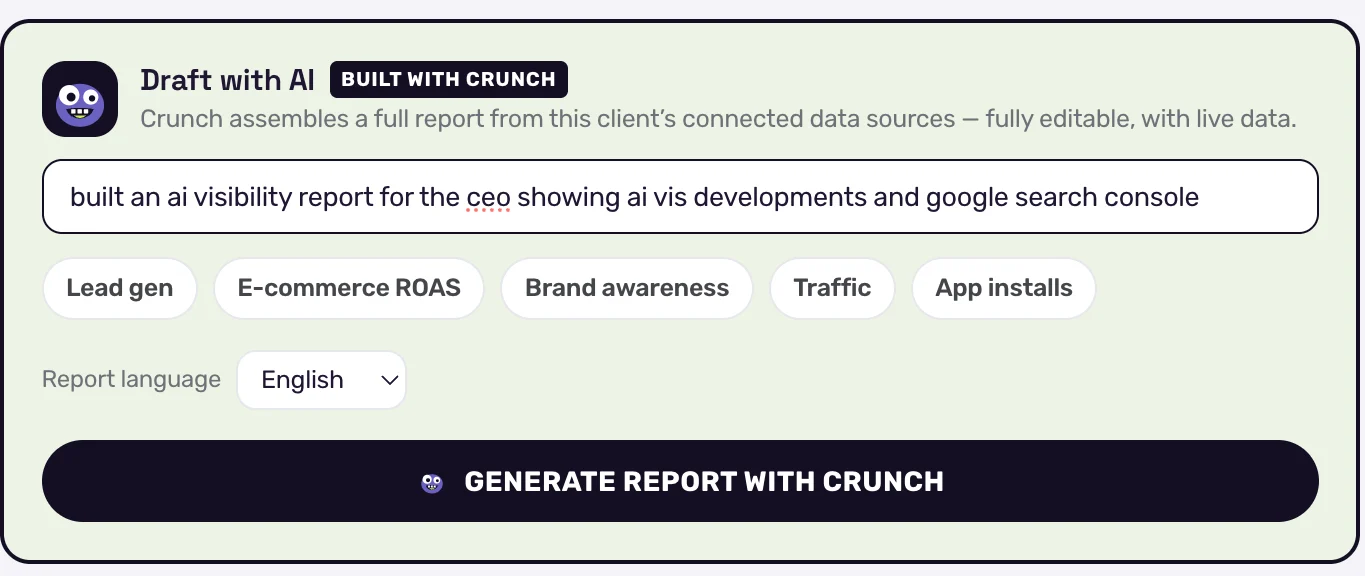
The mechanics should be boring. In CrunchJunkie the monthly report is drafted by describing it: "Monthly client report: AI visibility plus Google Ads plus GA4 — in German", and the draft assembles from the client's connected sources, fully editable. Scheduling sends it monthly without anyone remembering to; the client gets a live share link — same report, live data, no attachment archaeology — or a PDF when procurement insists.
Report language matters more than agencies expect: a report a client reads in their own language (ours generate in English, German, Spanish and French) beats a prettier one in yours. And the AI-written executive summary is drafted from the saved numbers — never invented client-side — then edited by a human, because the narrative is the part the client actually reads.
The monthly report, described in one sentence. The draft assembles from the client's connected data sources and stays fully editable.
Make it yours
The last mile is ownership. White-label — your logo, not your vendor's — is available from our Starter plan; from Pro the report lives on your own domain, so the client's bookmark says your brand. That's not vanity: an agency's AI-visibility service is worth a monthly line item precisely because the client experiences it as the agency's capability, not a reseller arrangement. We wrote separately about productizing white-label AI-visibility reporting — pricing structures, per-brand economics, the pitch. The report in this article is the deliverable that makes that line item renew itself.
Frequently asked questions
Five things: visibility with its margin of error and run count, share of voice against named competitors, average position, a per-engine breakdown, and the tie to outcomes — AI-referred sessions, conversions and revenue from the client's analytics. Plus a human-edited narrative and chart annotations for account events. Leave out raw mention counts without denominators, blended cross-engine scores, and anything measured once.
Monthly, on a schedule, compared month over month — never day over day, because run-to-run variance in AI answers makes daily movements mostly noise. The underlying scans run weekly or daily; the report aggregates them into a period a client can reason about, with each rate carrying its sample size.
Yes. In CrunchJunkie, white-label reports (your logo, your branding) are included from the Starter plan, and from Pro the reports live on your own custom domain. Clients receive a live share link or PDF that carries the agency's brand end to end, in the client's language — reports generate in English, German, Spanish and French.
One sentence: AI engines answer differently between runs, so we measure repeatedly and report the range the true rate sits in. Then let the report demonstrate it — when a change is within the margin, label it 'within margin' instead of celebrating it. Clients learn quickly that when your report does claim a move, it's real, which is exactly the trust an agency wants its numbers to have.
See your AI visibility on your own brand
Reporting and AI search visibility in one console — run your first report and scan inside the 14-day free trial.